What is the gender pay gap?

The gender pay gap is the difference in pay between men and women. It measures how women’s work is valued compared to men’s. The gender pay gap is based on data science and studied by multiple accredited institutions working on independent datasets.
We calculate and present the gender pay gap in two ways: controlled and uncontrolled.
The uncontrolled gender pay gap measures what women are earning in the workforce compared to men without accounting for job. The uncontrolled gender pay gap is sometimes called the “opportunity gap.” In 2025, the uncontrolled gender pay gap is $0.83, meaning that women collectively earn 17 percent less than men based on both the jobs they have and how they are paid in those jobs. This is unchanged from last year.
The controlled gender pay gap measures “equal pay for equal work,” meaning how women are paid compared to men in the same jobs or similar jobs with similar qualifications. When data are controlled for job title and other compensable factors, the gender pay gap narrows to $0.99, which is still a gap. This means that at least some women are receiving unequal pay for the same or similar work. This is also unchanged from last year.
The uncontrolled gender pay gap is not less meaningful than the controlled gender pay gap. The uncontrolled gender pay gap reveals the overall economic power disparity between men and women in society and how wealth and power are gendered. Even if the controlled gender pay gap disappears — meaning women and men with the same job title and qualifications are paid equally — an uncontrolled gap would still demonstrate that women are valued less by society for their work.
Payscale software and services can help employers study both the controlled and uncontrolled pay gap and help to close the controlled pay gap in their organizations.
Did the gender pay gap widen?
This year, Equal Pay Day falls on March 25, 2025. This date represents how many additional days into the year women must work to earn what men did in the previous year in the United States when data are uncontrolled. Equal Pay Day moved backward in 2025, from March 12 in 2024, representing a widening of the gender pay gap despite the passing of pay transparency legislation over the past few years.
In 2025, Payscale’s data do not show a significant widening of the gender pay gap; however, we also don’t see the incremental closing of the gap we are used to seeing. We do see widening in some segments.
We cannot definitively know the reason for the widening of the gender pay gap. It may be related to market dynamics as women returned to the workforce after the COVID-19 pandemic. It may also be related to shifting public sentiment and the Supreme Court striking down Affirmative Action in 2023, which resulted in corporations pulling back on diversity, equity, and inclusion (DEI).
The gap between what women and men are paid persists year over year. The uncontrolled gender pay gap tells us that high-earning jobs are occupied more by men than women, while the presence of the controlled gender pay gap tells us that women are still being paid less than men when doing the same jobs at least some of the time.
As our data will show, the gender pay gap persists even when men and women have the same education. It is wider for women who are parents and for women who work from home. The gender pay gap also widens as women age and progress in their careers.
The gender pay gap has been narrowing over time and has even closed in recent years for some occupations and industries, and in some state and metro areas for the controlled gender pay gap. Closing of the controlled gender pay gap in some locations may be the result of pay transparency legislation.
Is the gender pay gap meaningful?
Not everyone believes that the gender pay gap is real or that gender pay gap research is meaningful. Skeptics cite distrust of the motivations of institutions that perform gender pay gap research. Others believe that the data are legitimate, but that the gender pay gap is not indicative of systemic disadvantages women face in the workforce. Some people believe that women choose lower-paying jobs or are more suited for lower-paying jobs based on differences between the sexes that predispose women to be mothers and caretakers rather than earners.
Such widespread beliefs about the ineligibility of women to earn as much as men are at the root of the gender pay gap and what gender pay gap research measures.
While organizations may not knowingly pay women less than men, unconscious bias based on beliefs about women contribute to women being less likely to be considered for leadership positions, less likely to be promoted, less likely to be hired in certain fields, and less likely to be paid fairly, especially in jobs typically viewed as masculine.
A key factor at play here is that the structure of work in many industries is not well suited to accommodate women who work and have children. This is because work is still largely based on traditional models that assume an “ideal worker” is always available, has no caregiving responsibilities, and can prioritize work over everything else. This model clashes with the reality that women do a disproportionate share of childcare and unpaid household labor. It also disenfranchises men from their role in parenthood.
When it comes to the controlled gender pay gap, skeptics assert that women are paid less due to lower performance despite controlled gaps existing in all types of jobs, including jobs where women dominate, and where legislation requires men and women be paid equally when doing the same or similar work.
In Payscale’s 2025 Compensation Best Practices Report, we asked survey participants who are mainly HR leaders and compensation professionals whether gender pay gap research is meaningful. While a majority said yes (72 percent), almost a fifth said no (19 percent).

The gender pay gap over time
The gender pay gap has stalled in closing
The median salary for men is higher than the median salary for women and has been consistently since Payscale started tracking the gender pay gap. The difference between the earnings of women and men has shrunk, but only by an infinitesimal amount each year. The gender pay gap didn’t shrink at all in the last few years.

A common way to look at the gender pay gap is as a percentage of how much women make compared to what men make, or as a fraction of a dollar. In 2024, for every $1 that men make, women earn $0.83 when data are uncontrolled. This is what women make compared to men regardless of occupation, experience, education, or other compensable factors. Payscale can control for a wide variety of compensable factors, including job. When data are controlled, there is still a gap, with women making $0.99 for every $1 that men make.

Jobs with the widest pay gaps
Women make less than men in specific jobs
While women earn $0.99 compared to $1 for men when data are controlled, the pay gap is wider for some jobs than others. To show where women are earning less than men for the same or similar work, Payscale looked at the top 20 jobs with the widest controlled gender pay gaps.
The top 20 positions include the clergy, sales jobs, supervisor jobs, emergency responder jobs, finance jobs, skilled healthcare technician jobs, and more. Holistically, these are jobs subject to stronger gender norms. Half of the top 20 jobs* with the widest gender pay gaps this year were also on the list last year.
Note: Brief descriptions can be found in the methodology.

What causes the gender pay gap?
The causes of the gender pay gap are rooted in structural inequality and the differences in opportunities for men and women based on gender norms that affect and constrain the choices women make before they ever bargain with an employer over a wage. Understanding the factors that drive the gender pay gap and where the gaps are widest is an important consideration for a talent strategy that is inclusive, equitable, and fair.

Parent status
Women are penalized for being able to have children
The gender pay gap widens for parents. In our online salary survey, we asked respondents to share if they were a parent, and we leveraged this sample to analyze pay gaps among men and women with and without children. When women indicated they were a parent or primary caregiver, we observed a wider uncontrolled pay gap of $0.75 for every dollar earned by a male parent, which is the same as last year. When we hold all else equal, mothers earn $0.98 for every dollar earned by fathers with the same employment characteristics. This is unchanged from last year.
Conversely, the gender pay gap shrinks between men and women who are not parents. The uncontrolled pay gap decreases to $0.88 on the dollar, suggesting women without children face fewer social barriers in climbing the corporate ladder or securing demanding, higher-paying jobs (despite mothers being just as capable). However, there is still a gap, indicating that women are penalized for the expectation that they might one day become mothers, even if they don’t want to have children, otherwise known as the “childbearing penalty.”
Most interestingly, when we control gender pay gap analysis for job characteristics, we observe pay parity. Earnings of women without children keep pace with earnings of men without children. This supports research that suggests that having a child or being able to have a child is the primary or true cause of gender pay disparities.
There are a range of disadvantages that impact wage progression for mothers. Research shows women’s income decreases because they reduce their working hours to balance childcaring responsibilities more than men. Women also face biases around parenthood, such as the notion that working mothers are less committed to their jobs, which can inhibit career progression. Meanwhile, men are sometimes paid more after having children.

Fathers earns a pay premium
Women’s income can decrease when they have children because they have to reduce their working hours to balance childcaring responsibilities. This happens primarily to women despite men and women both being parents equally. Women also face other biases around parenthood that inhibit career progression, such as belief that working mothers are less committed to their jobs. Our data suggest that the main driver of the parent gender pay gap is men earning more after becoming fathers — while pay for mothers stagnates.
In our analysis, we found that childless men earn 84 percent of what fathers earn when data are uncontrolled. When data are controlled, childless women earn the same amount as mothers while fathers earn 2 percent more than childless men. In other words, fathers earn a premium.

Impact of parent status by race
This year, we also looked at the status of mothers compared to fathers by race. We find that women of color who are parents make substantially less relative to white men who are parents when data are controlled, with American Indian and Alaska Native mothers making the least and Asian mothers making the most. When data are controlled, the gender pay gap closes for Asian mothers and Hispanic mothers but not for other races.
For childless women of color, the pay gap is considerably smaller when data are uncontrolled and closes completely for women of color when data are controlled. This demonstrates that parenthood is not financially incentivizing for women of most races.

Age & Education
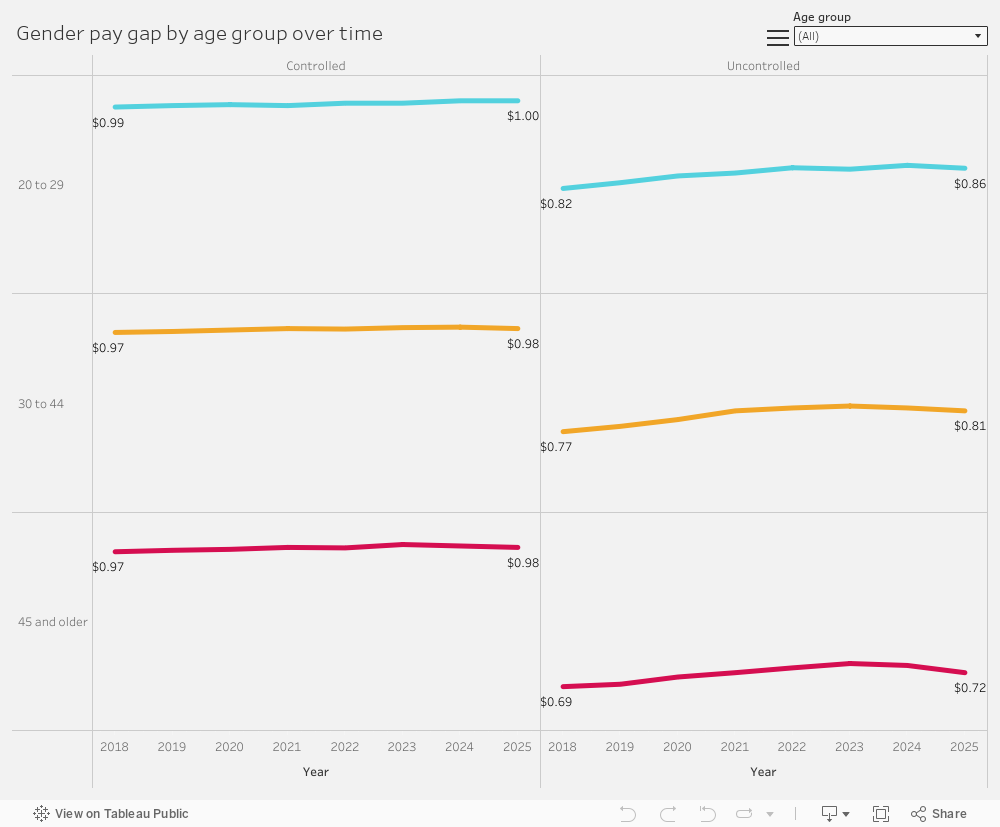
The gender pay gap widens as women age
Women start their careers earning less than men when data are uncontrolled, and the pay gap only widens as they age. Between the ages of 20 and 29, women earn $0.86 compared to every $1 that men earn, which is one point lower than last year. This is due to women being employed in jobs that do not pay as much compared to the jobs that men occupy. When controlled for job title and other compensable factors, women and men earn equal pay in the 20 to 29 age bracket. This is the same as last year.
However, the pay gap widens for women between the ages of 30 and 44, with women overall earning $0.81 compared to every $1 men earn when data are uncontrolled and $0.98 when controlling for job title and other compensable factors. At age 45 and older, the gap widens further for the uncontrolled group, with women making only $0.72 compared to every $1 men make, which has decreased by 2 cents.
The most likely explanation for the gender pay gap widening by age is women becoming mothers and leaving the workforce or taking on lower-paying jobs with more flexibility, incurring the motherhood penalty.

If we look at the gender pay gap by age over time, we can see incremental improvement from 2018 to 2022, even throughout the COVID-19 pandemic, but after the Great Resignation ended, progress flattened and has even started to decline, especially for older women.
The gender pay gap is not due to a lack of education
Higher education does not lead to pay equity for women. The gender pay gap sees minimal or no improvement at higher educational attainment levels compared to a high school degree, which has a controlled pay gap of $0.97. This year, we find that having a bachelor’s degree closes the gender pay gap when data are controlled. Other degrees only narrow it.
The widest uncontrolled gap is for women with MBAs, which has persisted year over year. Women with MBAs take home $0.77 for every dollar that men with MBAs take home. Women with health professional doctorates see the smallest pay gap at $0.89. Women with law degrees see an uncontrolled gender pay gap of $0.87, which has decreased by 1 cent.
The gap for women with an MBA may be due to different concentrations pursued. It may also be due to women not actually landing jobs that require an MBA or not working jobs requiring longer or more inflexible hours.

State & Metro
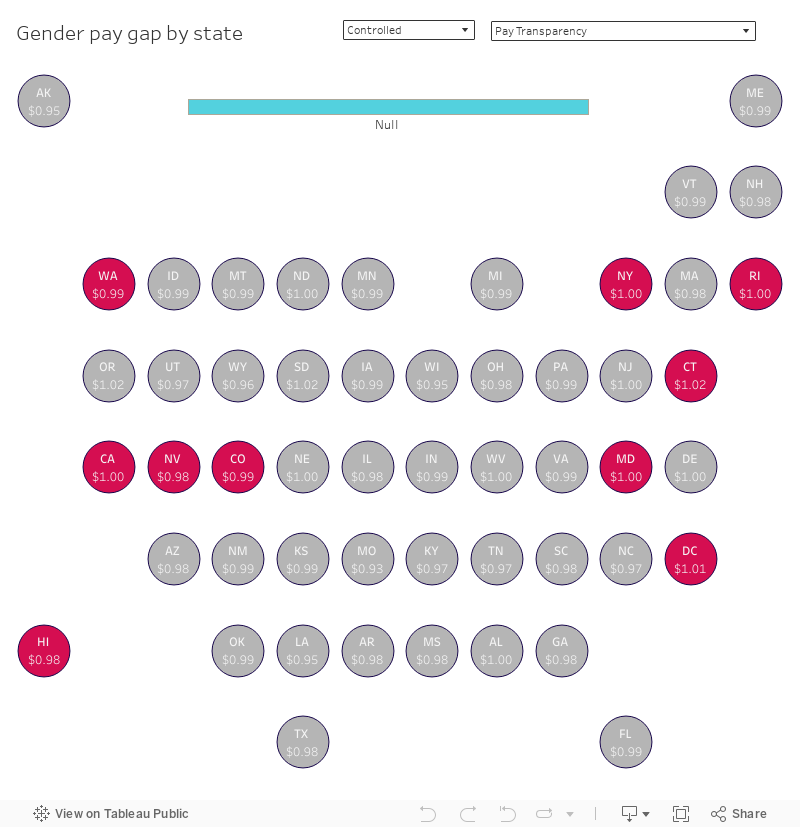
Pay transparency is closing the controlled gap
U.S. pay transparency legislation began requiring the publication of pay ranges in job ads in some states beginning in 2022, picked up steam in 2023 and 2024, and continues to expand in 2025. The intent behind this pay transparency legislation is to close pay gaps by forcing organizations to openly advertise pay ranges, thereby placing more information in the hands of employees to be assured they are being paid fairly.
States with pay transparency laws are starting to show evidence of closing the gender pay gap when data are controlled, although not fully or consistently yet. However, states without pay transparency laws have also closed the controlled gender pay gap, which could be attributed to growing awareness around pay equity from pay transparency legislation in other states and/or organizations adopting a national approach to pay transparency.
In 2025, the controlled pay gap remained closed for California, Connecticut, Maryland, New Jersey, New York, Oregon, and Washington, D.C. — which also showed closed pay gaps last year. However, pay gaps widened for Massachusetts, Montana, New Hampshire, North Carolina, New Mexico, Vermont, and Washington state. Pay gaps newly closed for Alabama, Delaware, Nebraska, North Dakota, Rhode Island, South Dakota, and West Virginia.
Six of 10 states with statewide pay transparency laws prior to 2025 have a closed gender pay gap when data are controlled. An additional four states with pay transparency laws have not closed the gender pay gap this year, which include Colorado, Hawaii, Nevada, and Washington. However, Colorado and Washington closed the controlled gender pay gap last year; some fluctuation is expected.
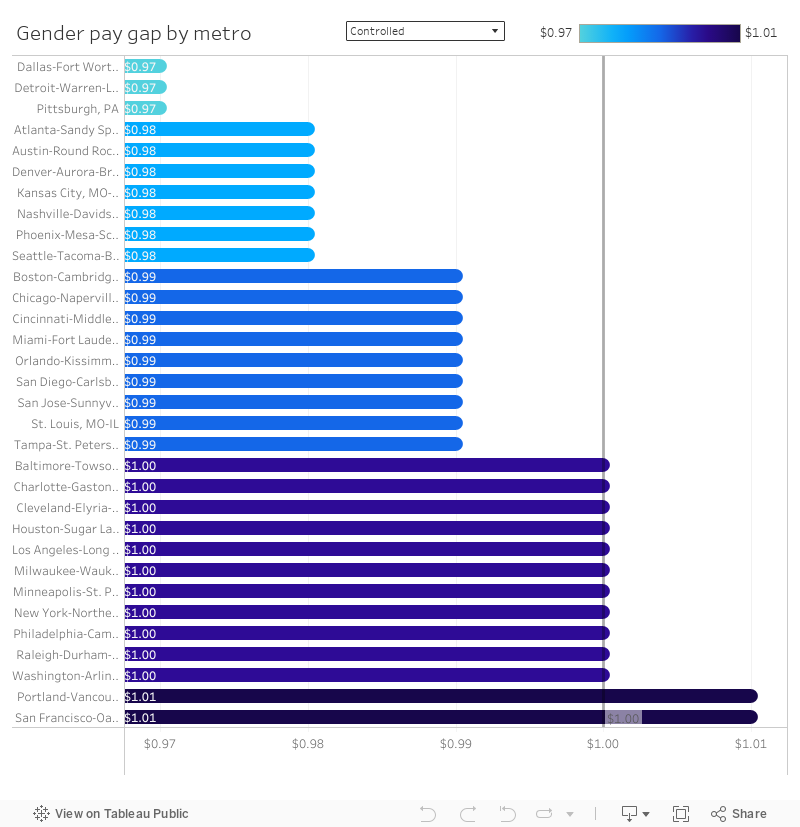
Pay transparency laws apply to municipalities too, so we also looked at the gender pay gap by major metro area. Metro locations with the widest uncontrolled gender pay gaps include Detroit, Cincinnati, and San Jose. The metros with the widest controlled gender pay gaps this year include Detroit, Dallas, and Pittsburgh.
Some metro areas showed that the gender pay gap closed for both controlled and uncontrolled pay data in 2023, following rapidly rising wages during the Great Resignation. However, in 2024 no metro areas closed the uncontrolled gender pay gap. That trend continues into 2025.
When it comes to the controlled gender pay gap, pay transparency legislation could be having a positive effect on major metros. Thirteen major metros have a closed controlled pay gap in 2025, including Baltimore, Charlotte, Cleveland, Houston, Los Angeles, Milwaukee, Minneapolis, New York, Philadelphia, Portland, Raleigh, San Francisco, and Washington, D.C.
The controlled gender pay gap widened for Boston, Orlando, San Diego, Seattle, and Tampa. Overall, more metros have closed the controlled gender pay gap in 2025 compared to 2024. Notably, only 4 out of 9 metros with pay transparency laws have closed, including Baltimore, Los Angeles, New York, and San Francisco. Metros with pay transparency laws that haven’t closed the controlled gender pay gap include Cincinnati, Denver, San Diego, San Jose, and Seattle. However, San Diego and Seattle closed the controlled gender pay gap last year.
Industry & Occupation
The controlled gender pay gap remains closed in some industries
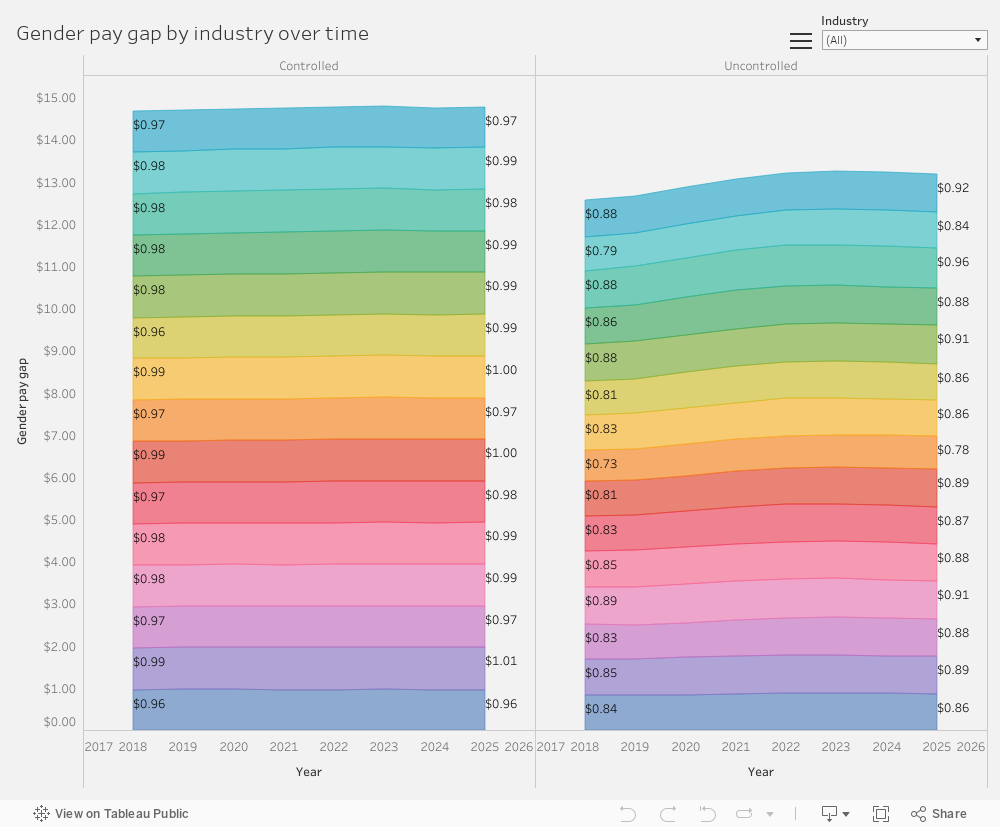
According to the Bureau of Labor Statistics (BLS), an agency of the Department of Labor (DoL), women are more heavily represented in industries such as Healthcare (76 percent), Education (69 percent), and Nonprofits (67 percent), which — not coincidentally — are more aligned with gender stereotypes about women being best suited for jobs related to caregiving and service to the community.
According to Payscale’s data, the uncontrolled gender pay gap is widest in Finance & Insurance ($0.78) and Agencies & Consultancies ($0.84), both of which have a higher percentage of women than men (53 percent and 59 percent, respectively), which is the same as last year. However, all industries have an uncontrolled pay gap, even in Healthcare ($0.89), Education ($0.91), and Nonprofits ($0.88) where women are more strongly represented.
When data are controlled, Technology, Engineering & Science and Healthcare achieve pay equity, closing the gender pay gap, while Transportation & Warehousing has the widest pay gap. While STEM-heavy industries are more likely to have pay parity when data are controlled, women are still underrepresented in higher-paying jobs within these industries.

When we look at industries over time, we see the uncontrolled pay gaps closing slowly while changes in the controlled pay gap fluctuates between closed and unclosed.
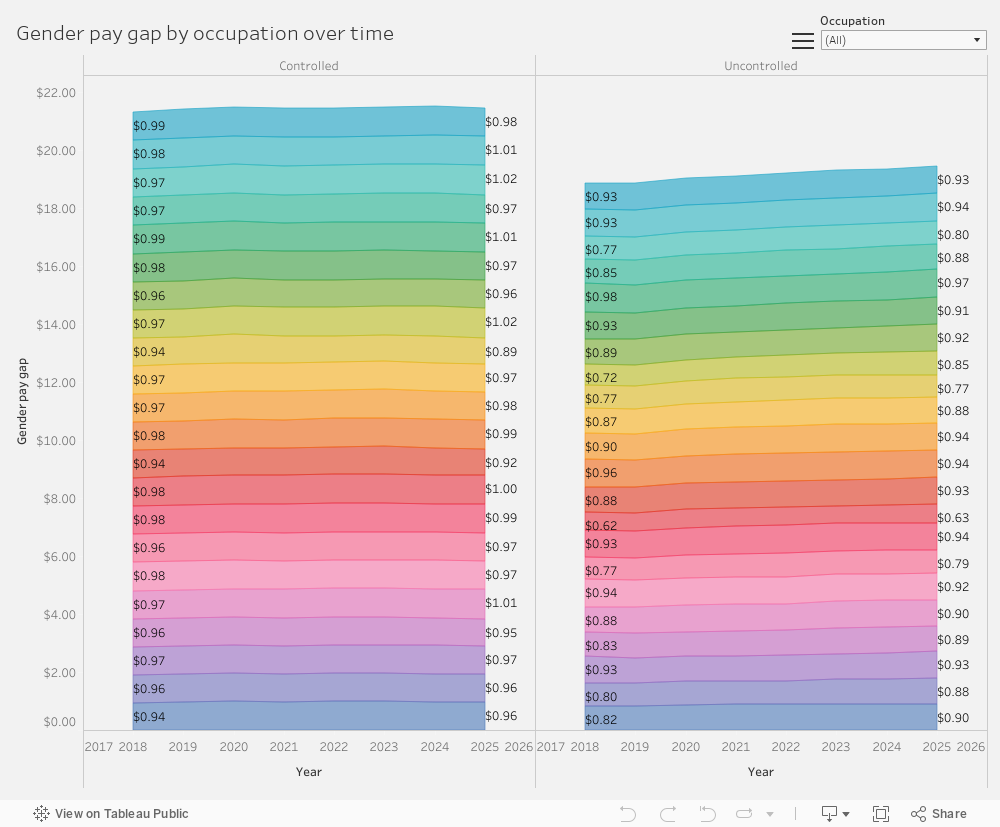
The gender pay gap widens for occupations with gender norms
Occupation refers to a roll-up of jobs that are within a similar field, but which may not be the same as the industry to which the organization belongs.
Women are most heavily represented in occupations including Healthcare Support; Healthcare Practitioners & Technical; Personal Care Services; Education, Training, & Library; Office Administrative Support; and Community and Social Services. These occupations mostly align to gender stereotypes that women are best suited for care and service roles. Women are still paid less in these occupational groups.
Payscale’s research shows women are paid less than men in every occupational group when data are uncontrolled, with the widest gaps being in Legal ($0.63); Farming, Fishing, & Forestry ($0.77); Management ($0.79); Building & Grounds Cleaning & Maintenance ($0.80); and Education, Training, & Library ($0.85). The smallest uncontrolled gap is in Community & Social Services ($0.97).
When data are controlled, the 2025 gender pay gap closes for occupations in Education, Training, & Library; Building & Grounds Cleaning & Maintenance; Community & Social Services; Arts, Design, Entertainment, Sports, & Media; Personal Care & Service; and Legal.
Some legislation has attempted to address pay equity by requiring analysis of traditionally male-dominated and female-dominated occupations, such as Canada’s Pay Equity Act, which was passed in 1987 and requires employers to evaluate gender predominance by job class; determine the value of each job according to skill, experience, working conditions, and other compensable factors; calculate the appropriate compensation; and compare pay and make adjustments to ensure equal pay for equal work.

The controlled pay gap has widened for Installation, Maintenance, & Repair and Management, where it had closed last year.
The occupation with the widest gender pay gap when data are controlled is Farming, Fishing, & Forestry ($0.89), which has widened compared to last year.
Some fluctuation year over year is normal, which can be observed in the interactive chart data, with the Community & Social Services occupation closing the controlled gender pay gap earlier than any other occupation.
Remote work status
Women who work from home experience a wider pay gap
In Payscale’s survey, we asked participants if they telecommuted, with answer choices ranging from No, I can’t telecommute to Yes, I can work from home some of the time or Yes, I work from home all of the time.
While there is an uncontrolled pay gap for women compared to men regardless of their work-from-home status, it is wider for women who work from home ($0.78). Those most likely to work from home are more likely to make higher salaries, but there are more men in high-paying roles, which explains this gap.
It should be noted that the controlled gender pay gap closes for women who work from home some of the time, which was also true last year. This suggests that women with some autonomy in choosing to work from home also have more pay equity.

Job-seeking status
The gender pay gap narrows for women who are seeking a new job
Women seeking a new job in the next six months see a narrower pay gap than women who said they were not. This suggests that women who are willing to leave their jobs are more likely to achieve higher pay, partially closing the gender pay gap.
Women who remain at their current job may feel more stuck in their position due to benefits they can’t give up due to parenting responsibilities, such as a flexible work schedule, and may tolerate lower pay for these exchanges. Women and men often have different priorities and experiences in the workplace, which influence their decisions to stay with or leave an employer. While factors like salary, career growth, and job security are important to both, research shows that women are more likely than men to prioritize workplace culture, flexibility, and support for work-life balance when deciding whether to stay with an employer.

Race & Ethnicity
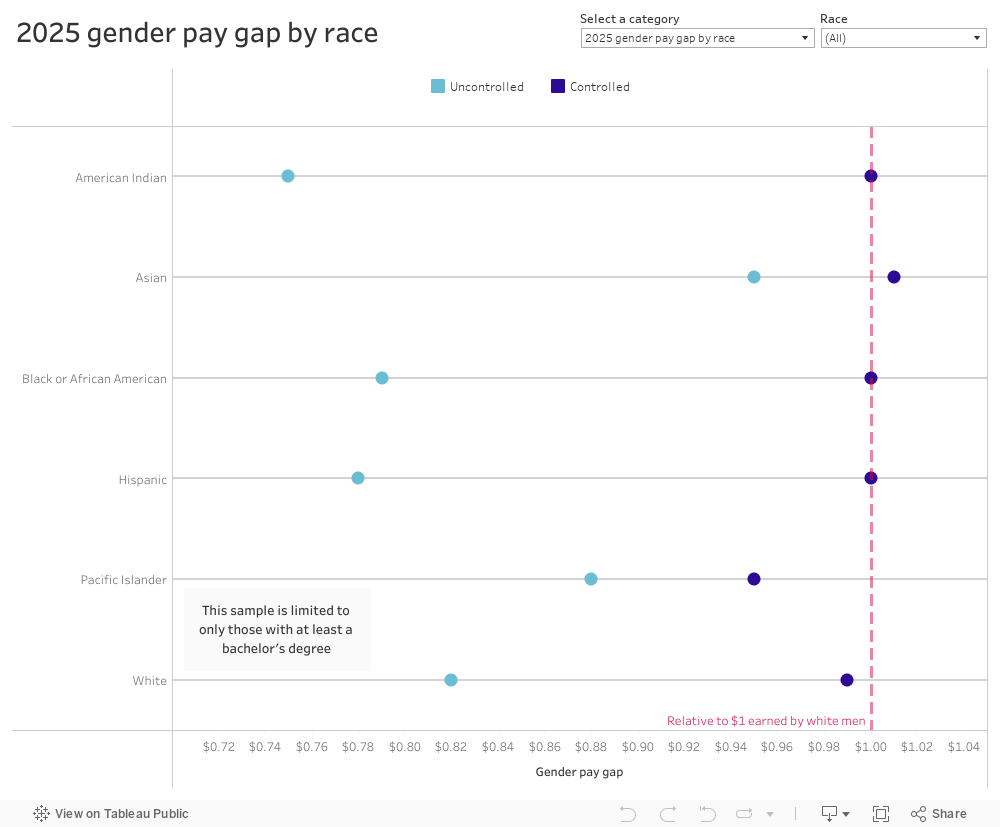
The gender pay gap has narrowed for women of color
Race and gender intersect and can result in wider pay gaps due to increased bias and different opportunity barriers. When Payscale analyzes the gender pay gap by race, we look only at respondents with a bachelor’s degree to account for bias. When the data are uncontrolled, women in every category see wider pay gaps compared to the overall uncontrolled gender pay gap ($0.83), except for Native Hawaiian and Other Pacific Islander ($0.88) and Asian women ($0.95). However, in 2025, most women of color within this segment achieve pay parity to men when data are controlled for compensable factors.
Career progression
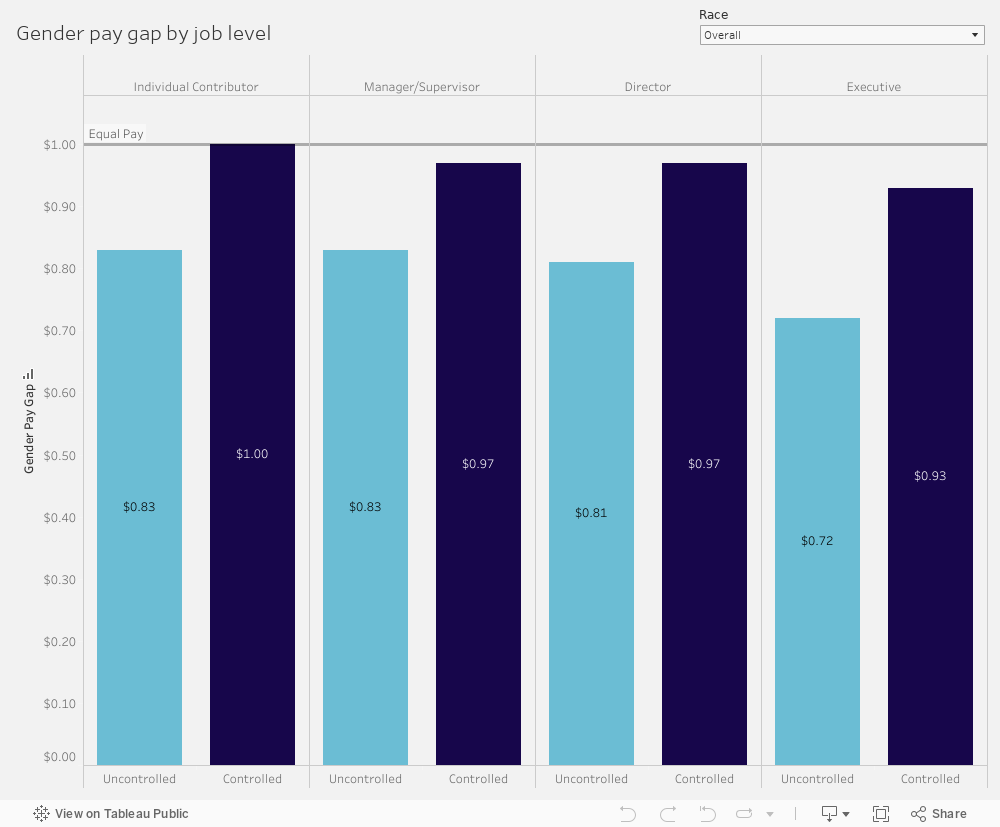
Women see wider pay gaps as they ascend the corporate ladder
Women are underrepresented in leadership roles compared to men. For example, 7 percent of white men become executives while only 5 percent of white women become executives. This number is further reduced for women of color.

Women also climb the career ladder more slowly than men. While men and women show equitable distribution across job levels ages 20 to 29, more men become managers between the ages of 30 and 44. At ages 45 years and older, men are more likely to be directors and much more likely to be executives while women are more likely to remain individual contributors throughout the duration of their careers.

Women who do climb the career ladder make less than their male counterparts, and the gap widens as women progress. It drops sharply at the executive level. In fact, women at the executive level make only $0.93 to every dollar a man makes, even when the same job characteristics are controlled for. In the uncontrolled group, women executives make $0.72 to every dollar a male executive makes.
While the gender pay gap has improved slightly at the executive level over time, it has dropped for other career levels, and the most for women in director-level roles.
We also looked at the intersection of job level and race and found that women are more likely to stagnate in their careers across the board. Women start out with controlled pay equity relative to white men at the individual contributor level, but as they progress up the corporate ladder, the gap widens. The gender pay gap is widest for Hispanic women and American Indian and Native Alaskan women at the executive level when data are controlled, currently standing at $0.91, which is two points narrower than last year.
When data are uncontrolled, the gender pay gap drops as low as $0.63 for American Indian and Native Alaskan women executives and varies between $0.76 and $0.84 for individual contributors.
Methodology
Between January 2023 and January 2025, over 369,000 people in the U.S. took Payscale’s online salary survey, providing information about their industry, occupation, location, and other compensable factors. They also reported demographic information, including age, gender, and race. We leveraged this sample to provide insights into the controlled and uncontrolled gender pay gap. To ensure a fair comparison, we convert hourly compensation to annual compensation where necessary and re-scale annual compensation to a 40-hour workweek where necessary.
Find out more about Payscale’s methodology.
It should be noted that Payscale’s employee-sourced online salary survey data weights toward salaried professionals with college degrees. When analyzing by race, we restrict our sample to those with at least a bachelor’s degree. This allows us to split data by demographic groups to make a meaningful comparison where our data is the strongest and to accurately report on racial pay gaps in the population. Our data isn’t as impacted by low-income hourly workers, so the data reported by Payscale might be dissimilar to what is reported by other institutions for the gender pay gap of the overall workforce.
Race/ethnicity
For analysis by race, we looked only at those with at least a bachelor’s degree. Racial gender pay gap numbers reported are relative to white men unless otherwise noted. Due to sample size issues, we are unable to report data on Native Hawaiian and other Pacific Islanders beyond the manager level.
Respondents could choose one or more of the following and could opt to self-identify in an open response:
- American Indian and Alaska Native
- Asian
- Black or African American
- Hispanic
- Native Hawaiian and Other Pacific Islander
- White
- Prefer not to answer
Only respondents who chose exactly one of the above were included in our analysis of the gender pay gap by race.
Parent, remote work, and job seeking status
We also ask respondents to the survey if they are a parent or able to work from home. We compare the GPG by parent and remote work status. This sample was collected between January 2023 and January 2025 and comprises 51,714 respondents to the parent question and 60,117 respondents to the remote status question. We also evaluate pay equity among workers who are planning to seek a new job in the next six months against those who plan to stay in their job; this sample comprises 161,749 respondents.
Are you a parent or primary caregiver?
- Yes
- No
Are you able to telecommute/work from home?
- Yes, I telecommute 100 percent of the time
- Yes, I telecommute most of the time
- Yes, I telecommute some of the time
- Yes, I telecommute on an as-needed basis only (e.g., furniture delivery)
- No, I can’t telecommute
Do you plan to seek a new job in the next six months? Yes/No
ONET job descriptions for top 20 jobs
O*NET OnLine has detailed descriptions of the world of work for use by job seekers, workforce development and HR professionals, students, developers, researchers, and more. https://www.onetonline.org/
Clergy: Conduct religious worship and perform other spiritual functions associated with beliefs and practices of religious faith or denomination. Provide spiritual and moral guidance and assistance to members.
Insurance Sales Agents: Sell life, property, casualty, health, automotive, or other types of insurance. May refer clients to independent brokers, work as an independent broker, or be employed by an insurance company.
First-Line Supervisors: Directly supervise and coordinate the daily work of non-management employees. They are the first level of management in an organization and are responsible for ensuring that employees follow policies and procedures.
Dispatchers, Except Police, Fire, and Ambulance: Schedule and dispatch workers, work crews, equipment, or service vehicles for conveyance of materials, freight, or passengers, or for normal installation, service, or emergency repairs rendered outside the place of business. Duties may include using a radio, telephone, or computer to transmit assignments and compiling statistics and reports on work progress.
Cost Estimators: Prepare cost estimates for product manufacturing, construction projects, or services to aid management in bidding on or determining the price of products or services. May specialize according to particular service performed or type of product manufactured.
Administrative Services Managers: Plan, direct, or coordinate one or more administrative services of an organization, such as records and information management, mail distribution, and other office support services.
Cardiovascular Technologists and Technicians: Conduct tests on pulmonary or cardiovascular systems of patients for diagnostic, therapeutic, or research purposes. May conduct or assist in electrocardiograms, cardiac catheterizations, pulmonary functions, lung capacity, and similar tests.
Claims Adjusters, Examiners, and Investigators: Review settled claims to determine that payments and settlements are made in accordance with company practices and procedures. Confer with legal counsel on claims requiring litigation. May also settle insurance claims.
Health and Safety Engineers, Except Mining: Promote worksite or product safety by applying knowledge of industrial processes, mechanics, chemistry, psychology, and industrial health and safety laws. Includes industrial product safety engineers.
Merchandise Displayers and Window Trimmers: Plan and erect commercial displays, such as those in windows and interiors of retail stores and at trade exhibitions.
Lodging Managers: Plan, direct, or coordinate activities of an organization or department that provides lodging and other accommodations.
Production, Planning, and Expediting Clerks: Coordinate and expedite the flow of work and materials within or between departments of an establishment according to production schedule. Duties include reviewing and distributing production, work, and shipment schedules; conferring with department supervisors to determine progress of work and completion dates; and compiling reports on progress of work, inventory levels, costs, and production problems.
Property, Real Estate, and Community Association Managers: Plan, direct, or coordinate the selling, buying, leasing, or governance activities of commercial, industrial, or residential real estate properties. Includes managers of homeowner and condominium associations, rented or leased housing units, buildings, or land (including rights-of-way).
Finance Managers: Plan, direct, or coordinate accounting, investing, banking, insurance, securities, and other financial activities of a branch, office, or department of an establishment.
Inspectors, Testers, Sorters, Samplers, and Weighers: Inspect, test, sort, sample, or weigh nonagricultural raw materials or processed, machined, fabricated, or assembled parts or products for defects, wear, and deviations from specifications. May use precision measuring instruments and complex test equipment.
Life, Physical, and Social Science Technicians, All Other: All life, physical, and social science technicians not listed separately, including Quality Control Analysts and Remote Sensing Technicians.
Database Administrators: Administer, test, and implement computer databases, applying knowledge of database management systems. Coordinate changes to computer databases. Identify, investigate, and resolve database performance issues, database capacity, and database scalability. May plan, coordinate, and implement security measures to safeguard computer databases.
Credit Analysts: Analyze credit data and financial statements of individuals or firms to determine the degree of risk involved in extending credit or lending money. Prepare reports with credit information for use in decision-making.
Pharmacy Technicians: Prepare medications under the direction of a pharmacist. May measure, mix, count out, label, and record amounts and dosages of medications according to prescription orders.
Retail Salespersons: Sell merchandise, such as furniture, motor vehicles, appliances, or apparel, to consumers.
Definitions
Total Cash Compensation: Total cash compensation (TCC) combines base annual salary or hourly wage, bonuses, profit sharing, tips, commissions, and other forms of cash earnings, as applicable. It does not include equity (stock) compensation, cash value of retirement benefits, or value of other non-cash benefits (e.g., healthcare).
Median Pay: The median pay is the national median (50th percentile) total cash compensation (TCC). Half the people doing the job earn more than the median, while half earn less.
Uncontrolled Gender Pay Gap: Median pay for men and women are examined separately, and the difference in the median is reported as the uncontrolled gender pay gap. Variables such as years of experience and education are not controlled for. This provides a picture of the differences in wages earned by men and women in an absolute sense.
Controlled Gender Pay Gap: This is the amount that a woman earns for every dollar that a comparable man earns. That is, this is the pay difference that exists between the genders after we control for all measured compensable factors. If the controlled pay gap is $0.97, then a woman would earn 97 cents for every dollar that a man with the same employment characteristics.
Controlled Median Pay: To illustrate the gender pay gap, we calculate this estimate of what the typical woman would earn if she occupied the same position as the typical man.
Unemployment Penalty: This is the percentage difference in the salary offered to an individual who is currently employed versus one who is currently unemployed, while controlling for relevant factors and excluding those who were unemployed to attend school or receive additional training. The unemployment penalty changes based on the duration of unemployment.
Industries: Payscale uses 15 industry categories that are custom aggregates of the North American Industry Classification System (NAICS).
Occupations: We report data for 22 occupations as defined by the Standard Occupational Classification System.
Job Levels
- Individual Contributor: Employees who do not manage others.
- Supervisors/Managers: Employees with people management responsibilities.
- Directors: Employees who manage managers but are below the level of vice president.
- Executives: Employees with the title of vice president or higher.
Percent men/women (BLS)
We present the gender breakdown by job group or industry according to the Bureau of Labor Statistics Current Population Survey from January 2024. For Industries, we calculated a weighted average of the custom Payscale aggregations of the North American Industry Classification System (NAICS) groups when definitions span multiple NAICS industries (e.g., Technology).
About Payscale
As the industry leader in compensation management, Payscale is on a mission to help job seekers, employees, and businesses get pay right and to make sustainable fair pay a reality. Empowering more than 65% of the Fortune 500, Payscale provides a combination of diverse and dynamic data sources, experienced compensation services, and scalable software to enable organizations such as Panasonic, ZoomInfo, Chipotle, AccentCare, University of Washington, American Airlines, and PetSmart to make fair and appropriate pay decisions.
Pay is powerful. To learn more, visit www.payscale.com.
Press contact
Download our infographic
Closing pay gaps requires fair pay practices that are both competitive to market and internally consistent for all new hires, promotions, and tenured employees. Download our infographic for quick stats on the state of the gender pay gap and learn how Payscale can help you with pay equity.